Cover photo by DeepMind on Unsplash
This week in tech class we touched on digital accessibility, which is defined as . . .
“The ability of all forms of digital content to be used and understood by a wide range of users, including those who have visual, auditory, motor or cognitive differing abilities.”
What Is Digital Accessibility?: Best Practices and Guidelines
For me, making websites accessible for everyone is less of a luxury, and rather a way of bringing everyone to the same level. I like to think of examples such as glasses, stools, translation apps, or even keyboards, as these are things that many people use in their everyday lives. We wouldn’t tell someone who wears glasses to see better, nor would we tell a shorter person to just grow taller. And so, a focus on making the web as accessible as possible will make for a better experience for everyone, and allow everyone to have a similar experience. Now you may be wondering, “how exactly am I supposed to do that? I don’t know the factors that make websites less accessible!” Well, lucky for you, there are super handy websites that tell you exactly what your site is lacking! We got to use the WAVE Web Accessibility Evaluation Tools in class today with our own website, and it helped me make the appropriate changes to promote more accessibility.
I wanted to include a website link that went along with this topic. I found a list of 8 Everyday Items Originally Invented for People With Disabilities, which further solidifies my belief that accessibility can benefit everyone, not just the audience it was specifically invented for. So many able-bodied people utilize these everyday things, which to me is yet another reason to place a lot of importance on accessibility for everything, not just the web.
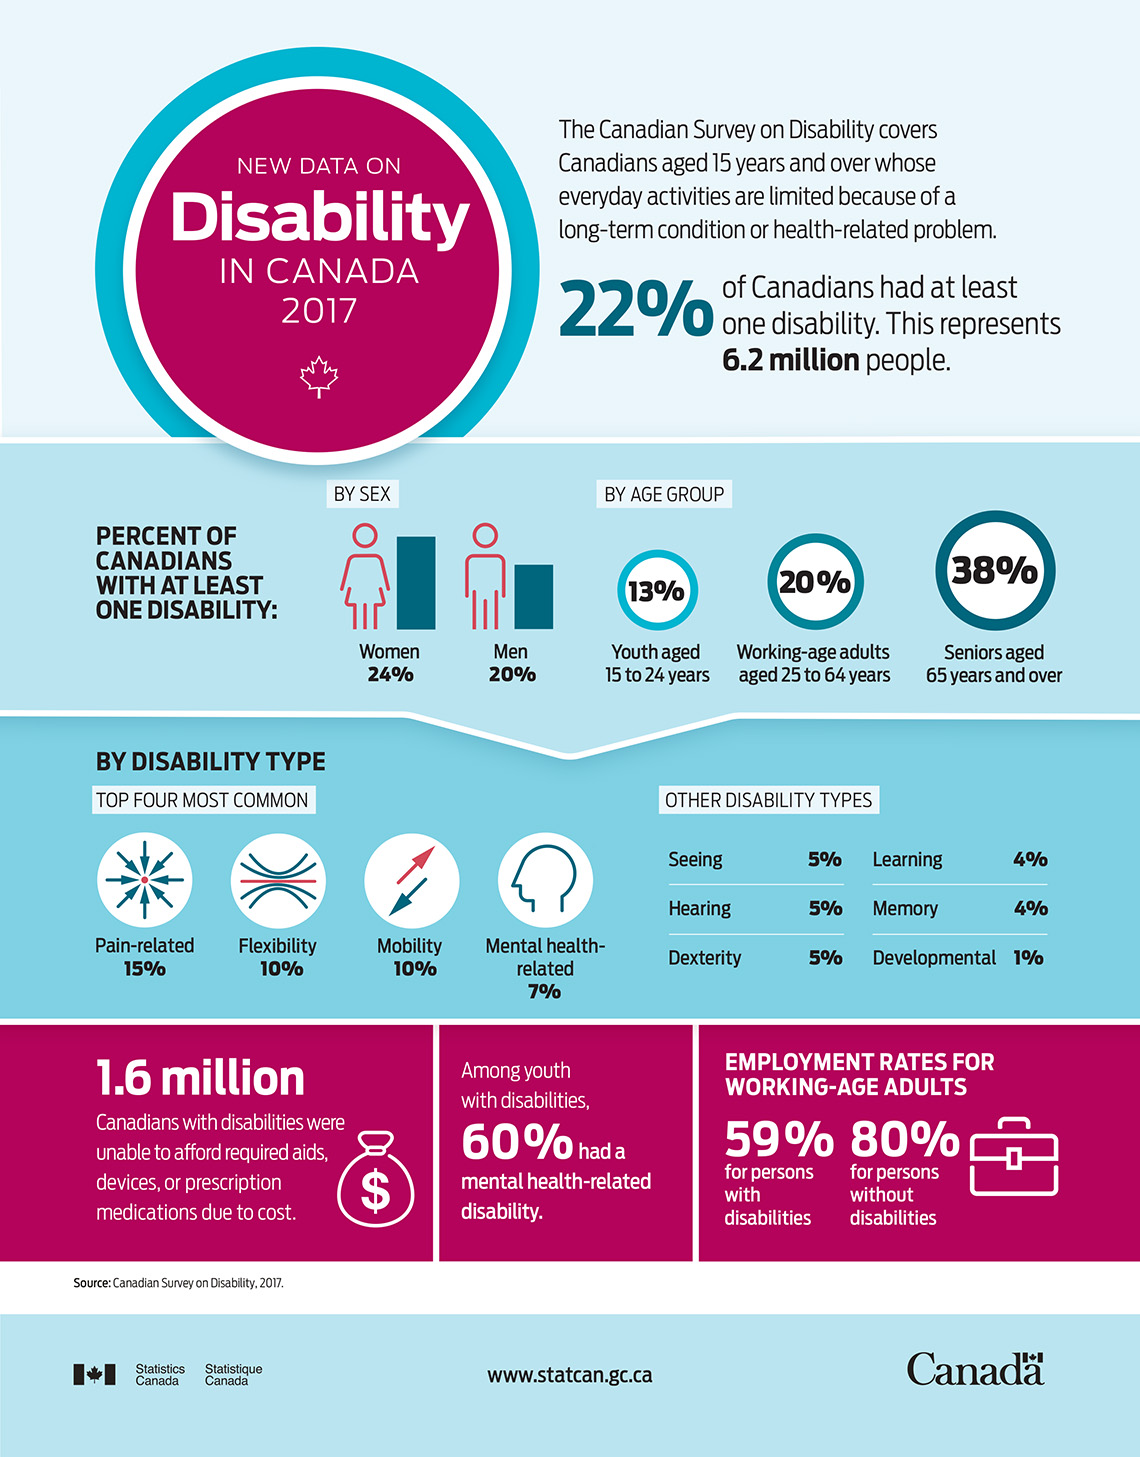
Something I found especially fascinating today was the number of Canadians that have at least one disability. This number was 6.2 million people, which to me made the need for accessibility even more important. I’ve included the graphic shared with us in our class below.
Overall, this was a class I was really looking forward to and I’m very happy with everything we learned today. I think these topics are important for teachers to know, understand, and be skilled in so that we can make our classrooms as accessible as possible for all of our students.
For the infographic in this post, I wrote up alt-text for it to make it accessible. I have also linked the video I made last week below which has captions to make it more accessible.